Page 27 - Fact_and_Figures_2012
P. 27
Sarawak Economy SARAWAK FACTS AND FIGURES 2012 21
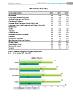
INFLATION ( 2010=100 )
Commodity Section 2010 2011 2012*
INFLATION 1.5 2.6 1.8
Food & Non-Alcoholic Beverages 1.8 3.3 3.9
Alcoholic Beverages and Tobacco 3.2 3.7 0.1
Clothing and Footwear -3.5 -0.9 -0.8
Housing, Water, Electricity, Gas and Other Fuels 1.3 2.3 1.1
Furnishings, Household Equipment and Routine Household 0.5 0.8 1.0
Maintenance
Health 2.6 3.3 2.6
Transport 1.6 4.4 0.0
Communication -0.4 -0.1 -0.4
Recreation Services and Culture 1.5 0.7 -1.2
Education 1.5 1.6 0.3
Restaurants and Hotels 0.7 5 1.9
Miscellaneous Goods and Services 2.6 1.3 1.9
Durable Goods 1.1 0.4 -0.8
Semi-Durable Goods -2.2 -0.2 -0.3
Non-Durable Goods 1.9 3.3 2.4
Services 1.4 2.6 1.7
Source : Malaysia Consumer Price Index, August 2012
Note : * Refer to July 2011 - July 2012
2.7
1.5
0.2
2.8
1.6
1.7
3.2
1.7
0.5
3.2
1.7
0.6
%