Page 32 - Fact_and_Figures_2012
P. 32
25 SARAWAK FACTS AND FIGURES 2012 Agriculture
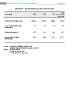
SARAWAK : MAJOR AGRICULTURE PRODUCTION
2012
Commodity 2009 2010 2011
Jan - July
Crude Palm Oil (‘000 tonnes) 1,994.8 2,179.5 2,696.2 1,462.6
Cocoa Beans (raw/roasted) 1.4 1.5 0.8 0.5
(‘000 tonnes)
Rubber (‘000 tonnes) * 26.7 33.3 38.2 17.2
Pepper (White & Black) 21.9 24.0 17.0** 12.1***
(‘000 tonnes)
Source : Yearbook of Statistics Sarawak 2011
Monthly Statistical Bulletin Sarawak, Sept 2012
Notes : * Refer to exports
** Refer to Jan-Jun 2011
*** Refer to Black Pepper only