Page 31 - Fact_and_Figures_2012
P. 31
Agriculture SARAWAK FACTS AND FIGURES 2012 24
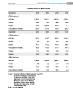
PLANTED AREA OF MAIN CROPS
MALAYSIA 2008 2009 2010 2011
(‘000 Hectares)
Oil Palm 4,487.9 4,691.1 4,853.8 4,976.0
Cocoa 20.9 19.3 20.8 20.2
Rubber 1,247 1,008.6 999.3 n.a
Paddy (Wet & Dry/Hill) 656.4 674.8 673.8 683.7
SARAWAK 2008 2009 2010 2011
(‘000 Hectares)
Oil Palm 744.4 839.7 919.4 1,021.6
Cocoa 5.5 6.3 8.4 8.5
Rubber 157.1 157.2 159.0 160.3
Paddy (Wet & Dry/Hill) 115.9 119.0 122.7 127.0
Pepper 11.3 10.9 14.0 15.0
SABAH 2008 2009 2010 2011
(‘000 Hectares)
Oil Palm 1,330.4 1,383.6 1,409.7 1,424.0
Cocoa 8.4 7.2 7.5 7.4
Rubber 75.1 75.0 94.7 n.a
Paddy (Wet & Dry/Hill) 38.9 43.6 40.6 n.a
Source : Monthly Statistical Bulletin Malaysia, Sept 2011
Yearbook of Statistics Sarawak 2011
Yearbook of Statistics Sabah 2011
Malaysian Palm Oil Board Website
Malaysian Cocoa Board Website
Malaysian Rubber Board Website
Department of Agriculture Website
State Planning Unit
Note : n.a not available