Page 26 - Fact_and_Figures_2012
P. 26
20 SARAWAK FACTS AND FIGURES 2012 Sarawak Economy
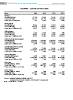
SARAWAK : MAJOR EXPORT ITEMS
Items 2009 2010 2011 2012*
Rubber
Quantity (‘000 kg) 26,730 33,299 38,153 15,739
Value (RM ‘000) 155,174 334,718 501,649 165,000
Export price (sen/kg fob) 581 1,005 1,315 1,048
Black pepper
Quantity (tonne) 10,563 11,518 11,954 4,326
Value (RM ‘000) 105,956 142,581 208,951 90,000
Export price (RM/tonne fob) 10,076 12,379 17,480 20,804
White pepper
Quantity (tonne) 2,553 2,836 2,940 995
Value (RM ‘000) 38,854 51,447 77,485 30,000
Export price (RM/tonne fob) 15,215 18,140 26,183 30,105.0
Palm oil (crude & processed)
Quantity (tonne) 2,020,070 2,435,807 2,605,405 1,295,572
Value (RM ‘000) 4,554,495 6,429,358 8,299,205 3,964,000
Export price (RM/tonne fob) 2,234 2,632 3,219 3,060
Liqueied Natural Gas (LNG)
Quantity (‘000 tonnes) 21,856 23,309 24,816 10,702
Value (RM ‘000) 31,195,016 38,099,139 50,256,588 26,398,000
Export price (RM/tonne fob) 1,427 1,635 2,025 2,467
Crude Petroleum
Quantity (‘000 tonnes) 8,385 8,087 8,268 3,742
Value (RM ‘000) 13,792,992 15,847,268 22,127,419 10,705,000
Export price (RM/tonne fob) 1,645 1,960 2,676 2,861
Saw Logs
Quantity (‘000 cu. metre) 3,667 3,839 2,999 1,279
Value (RM ‘000) 1,754,823 1,907,254 1,793,582 713,000
Export price (RM/cu. metre fob) 479 497 598 557
Sawn Timber
Quantity (‘000 cu. metre) 849 906 768 417
Value (RM ‘000) 781,776 819,590 705,858 1,102,000
Export price (RM/cu. metre fob) 921 905 920 951
Source : Monthly Statistical Bulletin, July 2012
Sarawak External Trade Statistics, 2012 (Tables & Summaries)
Note : * Refer to Jan - Ju 2012