Page 25 - Fact_and_Figures_2012
P. 25
Sarawak Economy SARAWAK FACTS AND FIGURES 2012 19
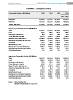
SARAWAK : EXTERNAL TRADE
Commodity Section (RM Million) 2009 2010 2011 2012
(Jan - July)
EXPORTS 61,968.0 76,272.0 97,378.0 60,225.5
IMPORTS 24,273.5 26,110.4 30,285.0 20,838.6
TRADE BALANCE 37,694.0 50,161.0 67,093.0 39,386.9
Exports by Commodity Section (RM Million)
Total 61,967.3 76,272.0 97,378.0 60,225.5
Food 510.0 668.0 845.8 499.6
Beverages and Tobacco 88.8 104.5 99.0 46.4
Crude Materials, Inedible 2,921.7 3,397.3 3,164.9 1,798.2
Mineral Fuels, Lubricants etc 44,408.8 55,881.6 73,858.7 46,012.9
Animal and Vegetable Oils and Fats 5,064.8 7,125.0 9,441.4 4,983.0
Chemicals 976.1 767.0 1,081.8 579.3
Manufactured Goods 4,792.4 5,228.0 5,846.2 3,912.1
Machinery & Transport Equipment 3,036.8 2,916.0 2,843.6 2,272.9
Miscellaneous Manufactured Articles 146.2 165.0 170.7 107.8
Other Miscellaneous 21.6 19.6 25.9 13.3
Imports by Commodity Section (RM Million)
Total 24,273.5 26,110.4 30,285.0 20,838.6
Food 2,622.8 2,861.2 3,287.9 2,011.3
Beverages and Tobacco 291.8 339.7 460.1 313.4
Crude Materials, Inedible 543.6 472.7 544.6 461.2
Mineral Fuels, Lubricants, etc 3,499.7 3,730.3 4,542.2 3,597.8
Animal and Vegetable Oils & Fats 87.0 98.4 52.4 33.4
Chemicals 2,837.0 3,442.1 4,065.4 2,482.3
Manufactured Goods 4,235.5 4,158.3 4,659.0 2,786.2
Machinery and Transport Equipment 8,332.2 8,900.2 10,550.9 7,974.4
Miscellaneous Manufactured Articles 1,571.6 1,929.5 1,991.3 1,112.6
Other Miscellaneous 252.4 178.0 131.2 72.0
Source : State Planning Unit
Monthly Statistical Bulletin, Sept 2012