Page 24 - Fact_and_Figures_2012
P. 24
18 SARAWAK FACTS AND FIGURES 2012 Sarawak Economy
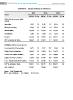
SARAWAK : GROSS DOMESTIC PRODUCT
2010 2011p 2012 f
Sector
RM Mil % Chg RM Mil % Chg RM Mil % Chg
REAL GDP (at constant 2000
prices)
Agriculture 7,929 3.8 8,192 3.3 8,374 2.2
Mining & Quarrying 9,233 4.3 9,269 0.4 9,456 2.0
Manufacturing 13,468 3.7 14,244 5.8 15,159 6.4
Construction 1,186 9.1 1,262 6.4 1,350 7.0
Services 18,729 5.0 19,641 4.9 20,557 4.7
GDP at purchasers’ value 50,805 4.5 52,927 4.2 55,292 4.5
NOMINAL GDP (at current prices)
Government Final Consumption 3,672 2.8 4,247 15.7 4,460 5.0
Private Final Consumption 19,055 6.3 21,979 15.3 22,870 4.1
Gross Fixed Capital Formation 9,547 7.4 9,927 4.0 10,468 5.4
Exports of Goods & Services 77,034 12.9 87,640 13.8 95,860 9.4
Less : Imports of Goods & Services 27,155 8.6 30,285 11.5 31,884 5.3
GDP at purchasers’ value 83,541 12.4 95,175 13.9 103,574 8.8
GDP / CAPITA 33,307 37,300 39,874
Source : State Planning Unit
Notes : (p) preliminary (e) estimate (f) forecast