Page 23 - Fact_and_Figures_2012
P. 23
Sarawak Economy SARAWAK FACTS AND FIGURES 2012 17
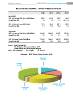
MALAYSIA AND SARAWAK : GROSS DOMESTIC PRODUCT
2009 2010 2011 p 2012 f
MALAYSIA
GDP at Constant 2005 Prices (RM Billion) 629.9 674.9 709.3 740.9
Growth Rate (%) -1.5 7.2 5.1 4.0 - 5.0
GDP at Current Prices (RM Billion) 712.9 795.0 881.1 936.8
Growth Rate (%) -7.4 11.5 15.0 6.3
SARAWAK
GDP at Constant 2000 Prices (RM Million) 48,601 50,805 52,927 55,292
Growth Rate (%) -1.5 4.5 4.2 4.5
GDP at Current Prices (RM Million) 74,325 83,541 95,175 103,574
Growth Rate (%) -14.0 12.4 13.9 8.8
Source : State Planning Unit
The Malaysian Economy in Figures 2012
Annual Report 2011, Bank Negara Malaysia
Notes : (p) preliminary (e) estimate (f) forecast
Sarawak : GDP Share (%) by Sector, 2012
Agriculture
(15.1%)
Services
(37.2%)
Mining & Quarrying
(17.1%)
Construction Manufacturing
(2.4%) (27.4%)