Page 19 - FDS Annual Report 2012
P. 19
ANNUAL REPORT 2012
FOREST DEPARTMENT SARAWAK 17
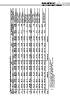
Table 6: Revenue Collected from National Parks, Nature Reserves and Wildlife Centres
No. Station PTJ Code Total (RM)
1 Taman Negara Mulu 3504112 1,237,524.45
2 Taman Negara Bako 3501109 710,120.00
3 Pejabat Tempahan Taman Negara Kuching 3501209 349,855.00 Trend /Direction Downward vs 2010 & 2011
4 Taman Negara Gua Niah 3504114 354,109.00 Downward vs 2010 & Downward vs 2010 & Downward vs 2010 & Downward vs 2010 & Downward vs 2010 & Downward vs 2010 &
5 Semenggoh Nature Reserve 3501228 497,863.00 68.04 Upward vs 2010 &2011 Upward vs 2010 & Upward vs 2010 & Upward vs 2010 &
6 Taman Negara Similajau 3509116 230,439.00 13.90 Upward vs 2011 5.57 Upaward vs 2011 13.28 Upaward vs 2011 2.30 Upaward vs 2011 (3.34) downward vs 2011 (13.93) Downward vs 2011 0.30 Upwnward vs 2011 (8.56) Downward vs 2011 (18.51) Downward vs 2011 (1.58) downward vs 2011
7 Taman Negara Lambir 3504113 215,109.00 % CHANGE(MONTHLY & TOTAL PRODUCTION)
8 Taman Negara Gunung Gading 3501220 158,522.00
9 Pusat Hidupan Liar Matang 3501110 169,679.00 (24.86)
10 Samajaya Nature Reserve 3501227 113,738.00 (12.71)
11 Taman Negara Kubah 3504115 93,602.00 2012/2011
12 Wind/Fairy Caves Nature Reserve 3501229 22,786.00
13 Taman Negara Logan Bunut 3504211 13,808.00
14 Taman Negara Tanjung Datu 3501230 4,961.00 (26.81) 34.00 (24.17) (14.14) 3.07 4.81 4.90 (0.24) 1.04 (3.01) (17.57) (26.37) (6.83)
15 Taman Negara Batang Ai 3502219 814.00 2012/2010
16 Taman Negara Talang Satang 3501235 10,240.00
17 Taman Negara Maludam 3502237 0.00
18 Pejabat Tempahan Taman Negara Miri 3504210 0.00
19 Pejabat Taman Negara Limbang 3505212 0.00 Total 554,779 864,736 853,593 806,696 883,209 845,412 784,388 813,636 850,006 826,692 725,681 649,735 9,458,563 788,213.62
Grand Total 4,183,169.45
Log Production 2012 Swamp 25,430 27,987 31,200 29,599 34,427 20,202 29,848 28,309 25,172 30,881 26,372 17,393 326,820
3
Log production during the year was 9,458,564 m , registering a marginal decline of 1.6% relative to
3
total log production in the previous year (9,610,434 m ). Pole production under category (P30) also Hill 529,350 836,749 822,393 777,097 848,782 825,210 754,540 785,327 824,834 795,810 699,309 632,343 9,131,744
indicated a decline from 1,665,647 pieces (2011) to 1,373,769 pieces or by 21%. The decline in log
and pole production was due to reduction in size of production areas or harvestable forest area.
Total 487,079 514,592 808,548 712,136 863,379 874,595 911,387 932,055 847,451 904,034 890,468 864,709 9,610,434 800,869.46
Table 7: Monthly Log Production Sarawak (Jan - Dec 2010 – 2012)
2011 Swamp 26,672 20,182 32,890 30,547 29,850 29,206 33,303 39,833 33,459 42,262 34,696 35,327 388,228
460,406 494,410 775,658 681,589 833,529 845,390 878,084 892,221 813,992 861,772 855,772 829,382
Hill 9,222,205
Total 757,979 645,331 1,125,667 939,501 856,874 806,585 747,737 815,630 841,275 852,388 880,371 882,428 10,151,766 845,980.52 As of Dec 2012, the total log production was 9,458,563 m 3 The total log production in 2011 was 9,610,434 m 3 Thus there was a decrease of 151,870 m 3 or 1.6 % over the
2010 Swamp 21,579 14,794 28,055 26,404 27,851 22,182 29,042 17,975 20,331 26,284 26,628 28,973 290,098 previous year's production
736,400 630,537 913,097 829,023 784,403 718,695 797,655 820,944 826,104 853,743 853,455
Hill 1,097,612 9,861,668 1. 2. 3. e g a
YEAR Month Jan Feb March April May Jun Jul Aug Sept Oct Nov Dec TOTAL MEAN 17 | P
16 | P a g e
FOREST DEPARTMENT SARAWAK 17
Table 6: Revenue Collected from National Parks, Nature Reserves and Wildlife Centres
No. Station PTJ Code Total (RM)
1 Taman Negara Mulu 3504112 1,237,524.45
2 Taman Negara Bako 3501109 710,120.00
3 Pejabat Tempahan Taman Negara Kuching 3501209 349,855.00 Trend /Direction Downward vs 2010 & 2011
4 Taman Negara Gua Niah 3504114 354,109.00 Downward vs 2010 & Downward vs 2010 & Downward vs 2010 & Downward vs 2010 & Downward vs 2010 & Downward vs 2010 &
5 Semenggoh Nature Reserve 3501228 497,863.00 68.04 Upward vs 2010 &2011 Upward vs 2010 & Upward vs 2010 & Upward vs 2010 &
6 Taman Negara Similajau 3509116 230,439.00 13.90 Upward vs 2011 5.57 Upaward vs 2011 13.28 Upaward vs 2011 2.30 Upaward vs 2011 (3.34) downward vs 2011 (13.93) Downward vs 2011 0.30 Upwnward vs 2011 (8.56) Downward vs 2011 (18.51) Downward vs 2011 (1.58) downward vs 2011
7 Taman Negara Lambir 3504113 215,109.00 % CHANGE(MONTHLY & TOTAL PRODUCTION)
8 Taman Negara Gunung Gading 3501220 158,522.00
9 Pusat Hidupan Liar Matang 3501110 169,679.00 (24.86)
10 Samajaya Nature Reserve 3501227 113,738.00 (12.71)
11 Taman Negara Kubah 3504115 93,602.00 2012/2011
12 Wind/Fairy Caves Nature Reserve 3501229 22,786.00
13 Taman Negara Logan Bunut 3504211 13,808.00
14 Taman Negara Tanjung Datu 3501230 4,961.00 (26.81) 34.00 (24.17) (14.14) 3.07 4.81 4.90 (0.24) 1.04 (3.01) (17.57) (26.37) (6.83)
15 Taman Negara Batang Ai 3502219 814.00 2012/2010
16 Taman Negara Talang Satang 3501235 10,240.00
17 Taman Negara Maludam 3502237 0.00
18 Pejabat Tempahan Taman Negara Miri 3504210 0.00
19 Pejabat Taman Negara Limbang 3505212 0.00 Total 554,779 864,736 853,593 806,696 883,209 845,412 784,388 813,636 850,006 826,692 725,681 649,735 9,458,563 788,213.62
Grand Total 4,183,169.45
Log Production 2012 Swamp 25,430 27,987 31,200 29,599 34,427 20,202 29,848 28,309 25,172 30,881 26,372 17,393 326,820
3
Log production during the year was 9,458,564 m , registering a marginal decline of 1.6% relative to
3
total log production in the previous year (9,610,434 m ). Pole production under category (P30) also Hill 529,350 836,749 822,393 777,097 848,782 825,210 754,540 785,327 824,834 795,810 699,309 632,343 9,131,744
indicated a decline from 1,665,647 pieces (2011) to 1,373,769 pieces or by 21%. The decline in log
and pole production was due to reduction in size of production areas or harvestable forest area.
Total 487,079 514,592 808,548 712,136 863,379 874,595 911,387 932,055 847,451 904,034 890,468 864,709 9,610,434 800,869.46
Table 7: Monthly Log Production Sarawak (Jan - Dec 2010 – 2012)
2011 Swamp 26,672 20,182 32,890 30,547 29,850 29,206 33,303 39,833 33,459 42,262 34,696 35,327 388,228
460,406 494,410 775,658 681,589 833,529 845,390 878,084 892,221 813,992 861,772 855,772 829,382
Hill 9,222,205
Total 757,979 645,331 1,125,667 939,501 856,874 806,585 747,737 815,630 841,275 852,388 880,371 882,428 10,151,766 845,980.52 As of Dec 2012, the total log production was 9,458,563 m 3 The total log production in 2011 was 9,610,434 m 3 Thus there was a decrease of 151,870 m 3 or 1.6 % over the
2010 Swamp 21,579 14,794 28,055 26,404 27,851 22,182 29,042 17,975 20,331 26,284 26,628 28,973 290,098 previous year's production
736,400 630,537 913,097 829,023 784,403 718,695 797,655 820,944 826,104 853,743 853,455
Hill 1,097,612 9,861,668 1. 2. 3. e g a
YEAR Month Jan Feb March April May Jun Jul Aug Sept Oct Nov Dec TOTAL MEAN 17 | P
16 | P a g e