Page 16 - AnnualReport2014
P. 16
CorPoraTE ProgrEss
WaTEr ProduCTion
The Board has two (2) treatment plants, namely Bukit Lima & Salim Water Treatment Plants with design
capacities of 45 MLD and 150 MLD respectively.
The Board produced a total of 46,803 ML fully treated water in the year 2014 or an average of 128.228
ML per day, a decrease of 1.64% from that of 2013. During the year, the Board recorded a maximum daily
production of 141.802 ML and a minimum daily production of 110.311 ML.
QuaLiTY ConTroL
Sibu Water Board (SWB) continued to treat and produce potable water according to the requirements stated
in National Drinking Water Quality Standard.
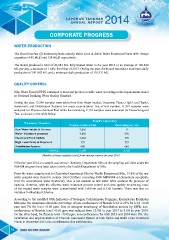
During the year, 13,546 samples were taken from Raw Water Intakes, Treatment Plants, High Level Tanks,
Reservoirs, and Distribution Systems for water examinations. Out of this number, 11,391 samples were
analyzed for Physico-chemical Test while the remaining 2,155 samples were examined for Bacteriological
Test, as shown in the table below:
Board’s Laboratory
Parameter / Location
Physico-chemical Test Bacteriological Test
Raw Water Intake & Sources 2,666 0
Water Treatment processes 4,856 476
Treatment Plant Outlets 2,666 476
High Level Tanks & Reservoir 555 555
Distribution Systems 648 648
TOTAL: 11,391 2,155
Number of water samples tested from various sources for year 2014.
Effective year 2014, no sample was sent to Chemistry Department Sibu as the sampling activities under the
KMAM program have been taken over by the Health Department of Sibu.
From the water samples sent to Chemistry Department Sibu by Health Department Sibu, 19.8% of the raw
water samples were found to contain Total Coliform exceeding 5000 MPN/100 ml (maximum acceptable
level for conventional water treatment). This is not unusual as raw water often contains the presence of
bacteria. However, with the effective water treatment process control and close quality monitoring, none
of the treated water samples were contaminated with Coliform and E.Coli bacteria. There was also no
violation for Residual Chlorine.
According to the modiied NIA Indicators of Bahagian Perkhidmatan Pergigian, Kementerian Kesihatan
Malaysia, the maximum allowable percentage of non-conformance of luoride level is 25% for level <0.40
ppm and 7% for level >0.60 ppm. Due to stringent monitoring of luoridation process by SWB, non-
conformance of luoride level >0.60 ppm was reduced from 12.0% in year 2013 to 8.3% in year 2014.
On the other hand, for luoride level <0.40 ppm, non-conformance for both 2013 and 2014 were 0%. The
installation and implementation of Fluoride Automated System at both Salim and Bukit Lima Treatment
Plants in December 2013 also contributed to this achievement.
16
WaTEr ProduCTion
The Board has two (2) treatment plants, namely Bukit Lima & Salim Water Treatment Plants with design
capacities of 45 MLD and 150 MLD respectively.
The Board produced a total of 46,803 ML fully treated water in the year 2014 or an average of 128.228
ML per day, a decrease of 1.64% from that of 2013. During the year, the Board recorded a maximum daily
production of 141.802 ML and a minimum daily production of 110.311 ML.
QuaLiTY ConTroL
Sibu Water Board (SWB) continued to treat and produce potable water according to the requirements stated
in National Drinking Water Quality Standard.
During the year, 13,546 samples were taken from Raw Water Intakes, Treatment Plants, High Level Tanks,
Reservoirs, and Distribution Systems for water examinations. Out of this number, 11,391 samples were
analyzed for Physico-chemical Test while the remaining 2,155 samples were examined for Bacteriological
Test, as shown in the table below:
Board’s Laboratory
Parameter / Location
Physico-chemical Test Bacteriological Test
Raw Water Intake & Sources 2,666 0
Water Treatment processes 4,856 476
Treatment Plant Outlets 2,666 476
High Level Tanks & Reservoir 555 555
Distribution Systems 648 648
TOTAL: 11,391 2,155
Number of water samples tested from various sources for year 2014.
Effective year 2014, no sample was sent to Chemistry Department Sibu as the sampling activities under the
KMAM program have been taken over by the Health Department of Sibu.
From the water samples sent to Chemistry Department Sibu by Health Department Sibu, 19.8% of the raw
water samples were found to contain Total Coliform exceeding 5000 MPN/100 ml (maximum acceptable
level for conventional water treatment). This is not unusual as raw water often contains the presence of
bacteria. However, with the effective water treatment process control and close quality monitoring, none
of the treated water samples were contaminated with Coliform and E.Coli bacteria. There was also no
violation for Residual Chlorine.
According to the modiied NIA Indicators of Bahagian Perkhidmatan Pergigian, Kementerian Kesihatan
Malaysia, the maximum allowable percentage of non-conformance of luoride level is 25% for level <0.40
ppm and 7% for level >0.60 ppm. Due to stringent monitoring of luoridation process by SWB, non-
conformance of luoride level >0.60 ppm was reduced from 12.0% in year 2013 to 8.3% in year 2014.
On the other hand, for luoride level <0.40 ppm, non-conformance for both 2013 and 2014 were 0%. The
installation and implementation of Fluoride Automated System at both Salim and Bukit Lima Treatment
Plants in December 2013 also contributed to this achievement.
16