Page 47 - Fact_and_Figures_2012
P. 47
Utilities and other services SARAWAK FACTS AND FIGURES 2012 37
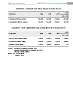
SARAWAK : CONSUMPTION AND PRODUCTION OF WATER
2012
Particulars 2009 2010 2011
Jan - July
Production (‘000 cu. metres) 330,998 354,692 376,649 225,368
Consumption (‘000 cu. metres) 238,188 264,199 270,820 166,295
SARAWAK : UNIT GENERATED AND CONSUMPTION OF ELECTRICITY
2012
Particulars 2009 2010 2011
Jan - July
Unit Generated (million KWH) 7,203.0 8,090.0 8,946.0 5,662.0
Consumption (million KWH) 5,844.0 6,752.0 7,720.0 4,960.0
Installed Capacity (MW) 1,230.3 1,972.9 2,862.7 * n.a
Source : Yearbook of Statistics Sarawak, 2011
Monthly Statistical Bulletin Sarawak, Sept 2012
Ministry of Public Utilities
Notes : n.a not available
* January - April