Page 49 - Fact_and_Figures_2012
P. 49
Utilities and other services SARAWAK FACTS AND FIGURES 2012 39
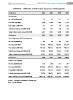
SARAWAK : PRINCIPAL STATISTICS OF SELECTED PROFESSIONS
Profession 2003 2004 2005 2007
Real Estates
No. of Establishments 13 13 12 13
Revenue (RM ‘000) 1,230 1,399 1,425 1,743
Expenditure (RM ‘000) 779 883 795 1,299
Salaries and wages paid (RM ‘000) 234 281 438 626
Value of ixed assets owned (RM ‘000) 1,344 1,673 1,638 1,679
Profession 2004 2005 2006 2008
Travel Agencies and Tour Operators
No. of Establishments 104 99 107 102
Revenue (RM ‘000) 118,562 165,483 136,963 155,234
Expenditure (RM ‘000) 113,158 140,138 103,141 143,870
Salaries and wages paid (RM ‘000) 17,391 19,040 20,661 22,385
Value of ixed assets owned (RM ‘000) 17,027 18,260 21,951 25,276
Profession 2006 2007 2008 2009p
Hotels and Lodgings
No. of Establishments 278 288 277 285
Revenue (RM ‘000) 361,983 386,010 406,777 440.71
Expenditure (RM ‘000) 163,587 343,254 356,015 184.19
Salaries and wages paid (RM ‘000) 78,703 80,623 86,831 91,807
Value of ixed assets owned (RM ‘000) 1,407,530 1,306,365 1,318,272 1,606.22
Source : Yearbook of Statistics Sarawak 2011
Note : (p) preliminary