Page 39 - Swb_2016
P. 39
fInAnCIAl STATISTICS
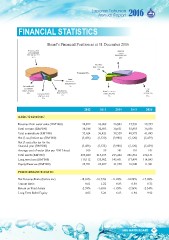
Board’s Financial Position as at 31 December 2016
Property, plant Deferred
and equipment income
RM188,045,722 RM49,818,245
81% 21%
Payables
RM18,255,441
8%
Financed by :
Other
investment
RM2,000,000
Cash and cash 1%
equivalents Loan
RM31,694,584 Inventories Board's reserves RM
14% Owing to SWB RM2,709,057 RM11,500,963 152,556,228
RM7,681,514 1% 5% 66%
3%
2012 2013 2014 2015 2016
BasIC sTaTIsTIC
Revenue from water sales ( RM’000) 24,822 26,069 26,803 27,739 29,297
Total revenue (RM’000) 30,188 32,895 34,651 35,855 36,056
Total expenditure (RM’000) 35,624 36,425 38,559 40,975 41,495
Net (Loss) before tax (RM’000) (5,436) (3,530) (3,908) (5,120) (5,439)
Net (Loss) after tax for the
inancial year (RM’000) (5,436) (3,532) (3,908) (5,120) (5,439)
Average cost of water (Sen per ‘000 Litres) 105 99 101 101 101
Total assets (RM’000) 209,840 213,103 213,242 226,512 232,131
Long term loan (RM’000) 119,112 135,902 145,451 117,499 114,045
Equity/Reserves (RM’000) 29,391 25,857 21,950 16,940 11,501
PErForManCE raTIo
Net Revenue Ratio (before tax) -18.01% -10.73% -11.28% -14.28% -15.08%
Current Ratio 0.61 1.22 0.83 0.50 0.75
Return on Total Assets -2.59% -1.66% -1.83% -2.26% -2.34%
Long Term Debt/ Equity 4.05 5.26 6.63 6.94 9.92
Sibu Water board 37