Page 38 - Swb_2016
P. 38
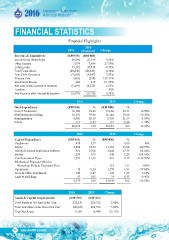
fInAnCIAl STATISTICS
Financial Highlights
2015
2016 (restated) Change
revenue & Expenditure (rM’000) (rM’000)
Income from Water Sales 29,298 27,739 5.62%
Other Income 5,874 7,699 -23.70%
Total Income 35,172 35,438 -0.75%
Total Expenditure (40,830) (40,685) 0.36%
Loss From Operation (5,658) (5,247) 7.83%
Finance Cost (665) (290) 129.31%
Investment Income 884 417 111.99%
Net Loss before Interest & taxation (5,439) (5,120) 6.23%
Taxation - - N/A
Net Revenue after Interest & taxation (5,439) (5,120) 6.23%
2016 2015 Change
Total Expenditure (rM’000) % (rM’000) %
Cost of Production 16,120 39.48 15,666 38.51 +2.90%
Distribution and Selling 16,193 39.66 16,144 39.68 +0.30%
Administration 8,406 20.59 8,760 21.53 -4.04%
Others 113 0.27 115 0.28 -1.74%
40,832 100 40,685 100 +0.36%
2016 2015 Change
Capital Expenditure (rM’000) % (rM’000) %
Headworks 470 7.37 - 0.00 N/A
Mains 2,208 34.62 11,365 56.98 -80.57%
GIS & its related application software 961 15.08 5,462 27.39 -82.41%
Meters 299 4.69 240 1.20 +24.58%
Communication Pipes 1,991 31.22 831 4.17 +139.59%
Mechanical Plant and Vehicles
Workshop, Field & Treatment Plant - - 222 1.11 -100%
Equipment 32 0.50 1,378 6.91 -97.68%
Store & Ofice Equipment 349 5.47 372 1.87 -6.18%
Land & Buildings 67 1.05 74 0.37 -9.46%
6,377 100 19,944 100 -68.03%
2016 2015 Change
assets & Capital requirements (rM’000) (rM’000)
Total Assets at the End of the Year 232,131 226,512 2.48%
Total Liabilities at the End of the Year 220,630 209,572 5.28%
Total Net Assets 11,501 16,940 -32.11%
36 Sibu Water board