Page 56 - AnnualReport2014
P. 56
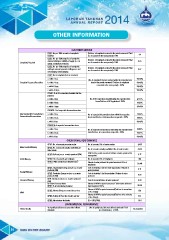
oTHEr inForMaTion
CUSTOMER SERVICE
CS1/1: No. per 1000 accounts of compliants (Total no. of complaints received in the period concerned / Total 4.4
received no. of accounts in the same period) x 1000
CS1/2: No. per 1000 properties of complaints (Total no. of complaints received in the period concerned / Total
Complaints Received received relating to reliability of supply ( i.e. on no. of accounts in the same period) x 1000 0.75
quality, continuity & pressure )
CS1/3: No. per 1000 properties of complaints (Total no. of complaints received in the period concerned / Total
relating to account payments, billing errors and no. of accounts in the same period) x 1000 0.27
overcharging / undercharging
CS2/1: No of complaints that are resoloved
a. within 1 day (No. of complaints that are resolved within the respective time 100.00%
Complaint Response/Resolution b. within 2 days fram for the period concerned / Total no. of compliants 100.00%
c. within 5 days concerned in the same period) x 100% 100.00%
c. within 10 days 100.00%
CSS3/1: % of NS connections installed after fee
payment
a. within 2 day No. of NS connections installed within the respective time 47.13%
b. within 4 days frame/Total no. of NS Application X 100% 88.63%
c. within 7 days 100.00%
CSS3/2/1: % of requested disconnections done
New Service (NS) Connections & a. within 1 day No. of requested disconnections done within the respective 73.54%
Disonnections/Reconnections b. within 2 days time frame/Total no. of disconnections requested x 100% 89.94%
c. within 3days 100.00%
CS3/2/2 % of requested reconnections done
a. within 1 day No. of requested reconnections done within the respective time 83.69%
b. within 2 days frame/Total no. of reconnections requested x 100% 94.37%
c. within 3days 100.00%
OPERATIONAL PERFORMANCE
OP1/1: No. of accounts per meter reader No. of accounts / No. of meter readers 4,496
Meter Reader Efficiency OP1/2: No. of accounts actually read/ billed per
meter reader No. of accounts actually read/billed / No. of meter readers 4,496
OP2/1:Staff cost per cu. m water produced (RM) Staff Cost for period concerned / Volume of water produced for 0.17
same period
Staff Efficiency OP/2/2: No. of accounts per employee No. of accounts / No. of employees 346
3
OP/2/3: Water produced per employee (m ) Volume of water produced for period concerned / No. of
employees 21,440
OP3/1: Organisation Energy cost per cu. m water Cost of electricity & fuel for whole organisation / Volume of 0.11
Energy Efficiency produced (RM) water produced
Cost of electricity & fuel for production / Volume of water
OP3/2: Production Energy cost per cu. m water
produced (RM) produced 0.08
Chemical Efficiency OP/4: Chemical cost per cu. m water produced Cost of chemical/Volume of water produced 0.04
(RM)
OP5 Non Revenue Water Volume of NRW for period concerned / Total volume delivered 30.5%
OP5/1: % of total volume produced from the plant x 100 %
OP5/2: Volume (litres) per connection per day Volume of NRW for period concerned/(Total no. of connections 620
NRW x No. of days)
OP5/3: Volume (m ) per km of mains per day Volume of NRW for period concerned/(Total no. of km of mains 33.1
3
x No. of days)
OP5/4: Infrustructure leak index ILI = CARL/UARL 18.4
ENVIRONMENTAL PERFORMANCE
Effluent Quality % of quality test that meets prescribed effluent ( No. of quality tests that meet effluent standards / Total No Available
no. of tests done ) x 100%
standards
56