Page 55 - AnnualReport2014
P. 55
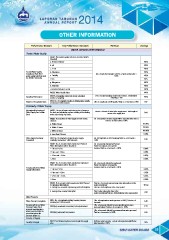
oTHEr inForMaTion
Performance Measure Key Performance Indicators Formula Average
WATER SERVICES PERFORMANCE
Treated Water Quality
WS2/1: (% of water quality tests that meet the NDWQ
Standard)
a. Residue Chlorine 100%
b. pH 100%
c. E Coli 100%
Treated Water Quality d. Aluminium 100%
Compliance Rate (% of (No. of tests that comply / Total No. of tests carried out) x
water quality tests that meet e. Turbidity 100% 100%
the NDWQ Standards) f. Iron 98%
g. Manganese 100%
h. Ammonia 100%
i. Residual Chlorine & E Coli 100%
WS2/2: Water Quality Index 100%
Sampling Performance WS3:% of sampling carried out versus scheduled ( No. of actual sampling carried out / Total no. of scheduled 100%
sampling ) x 100
number of sampling
Number of Complaints Index WS4: No. of complaints relating to drinking water quality (No. of compliants on DW quality / Total no. of services) x 1000 0.07
received per 1000 accounts
Continuity of Water Supply
Interruption/Restoration of WS6/1: The no. of bursts and leaks per km. of mains in
Water Supply Due to Main the trunk and reticulation system resulting in the drinking Total no. of bursts & leaks in the supply area / Total length of 0.04
mains in the supply area
Burst water mains being shut down.
WS6/2: % restoration of water supply for main bursts No. of restoration of water supply within respective time frame /
effected:
Total no. of main bursts x 100%
a. Within 6 hours 94.79%
b. Within 12 hours 99.84%
c. Within 24 hours 100.00%
d. more than 24 hours 0.00%
Water Supply Continuity WS7: No. of complaints relating to water supply No. of complaints on DW Continuity/Total no. of accounts x 0.28
Complaints continuity received per 1,000 accounts 1,000
WS8/1: No. of accounts which experienced Planned No. of accounts affected by Planned
Water Interruptions where duration is : Water Interruptions of respective
> 1 hr and < 5 hrs duration /Total no. of accounts x 100% 0.85%
> 5 hrs and < 12 hrs 0.85%
> 12 hrs and < 24 hrs 0.85%
> 24 hrs 0.00%
WS8/2: No. of accounts which experienced unplanned No. of accounts affected by unplanned
Water Interruptions where duration is : Water Interruptions of respective
Frequency/Extent of Water duration /Total no. of accounts x 100%
Supply Interruptions > 1 hr and < 5 hrs 3.23%
> 5 hrs and < 12 hrs 4.82%
> 12 hrs and < 24 hrs 5.66%
> 24 hrs 0.00%
WS8/3: % of accounts which experienced both Planned Total no. of accounts experiencing water interruptions in the
& Unplanned interruptions: period considered/ 111.60
a. average no. accounts experiencing water interruptions Total no. of interruptions in the same period
b. average time of water interruption Total water interruption time in the 2.60
period considered/Total no. of interruptions in the same period
Water Pressure
Water Pressure Complaints WS9 : No. of complaints relating to water pressure ( No. of complaints on water pressure x 1000 ) / Total no. of 0.40
accounts
received per 1,000 accounts
Frequency/Extent of Water WS10(a): occasional or recurrent, but not permanent ( No. of accounts affected by occasional/recurrent water 0.10
Presurre Failure (% of pressure failure / Total no. of accounts ) x 100%
accounts experiencing a
water pressure failure as WS10(b): permanent low pressure ( No. of accounts affected by permanent low water pressure / 0.25
Total no. of accounts ) x 100%
prescribed where the
pressure failure is:)
Security of Supply
Security of Supply WS11: % of treatment plant reserve margin for supply (Effective plant capacity - current actual production)/effective 34%
area
plant capacity x 100%
55