Page 8 - Fact_and_Figures_2012
P. 8
3 SARAWAK FACTS AND FIGURES 2012 Background Information
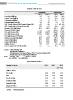
BASIC STATISTICS
SARAWAK MALAYSIA
2011 2012 e 2011 2012 e
Population (Million) 2.5 2.6 28.6 28.9
Labour Force (Million) 1.1 1.1 12.6 12.9
Employment (Million) 1.1 1.1 12.2 12.5
Unemployment Rate (%) 4.5 4.5 3.1 3.2
GDP Growth Rate at 2000 Constant Prices (%) 4.2 4.5 5.1 4.0 - 5.0
GDP Growth Rate at Current Prices (%) 13.9 8.8 15.0 6.3
Nominal GDP (RM Billion) 95.2 103.6 881.1 936.8
Nominal GNI (RM Billion) n.a n.a 859.0 917.5
Per capita income RM 37,300 39,874 29,661 31,215
Per capita income US$ 12,229 13,073 9,693 9,755
Per capita income PPP (US$) n.a n.a 17,250 18,023
Balance of Trade (RM Billion) 67.2 39.4* 147.5 155.6
Exports (RM Billion) 97.9 60.2* 696.0 717.8
Imports (RM Billion) 30.3 20.8* 548.5 562.2
Inlation (% p.a) 2.6 2.1** 3.2 2.5 - 3.0
Current account of BOP (% of GNI) n.a n.a 11.3 12.0
Source : State Planning Unit
Department of Statistics
The Malaysian Economy in Figures 2012, Economic Planning Unit
Annual Report 2011, Bank Negara Malaysia
Notes : * January - July ** January - August
(e) estimate (p) preliminary
EXCHANGE RATES
Foreign Currency 2010 2011 2012
Jan - Aug
( RM per Unit )
U.S. Dollar 3.22 3.06 3.10
Euro 4.28 4.26 3.97
Pound Sterling 4.98 4.9 4.89
Canadian Dollar 3.13 3.11 3.14
Australian Dollar 2.96 3.16 3.20
Singapore Dollar 2.36 2.43 2.46
Source : www.bnm.gov.my